
Glycemic Index is a measure of how much the blood sugar (i.e. glucose) increases after one eats a certain food. Pure glucose has a GI of 100 and all other foods are ranked with reference to this. GI is a relative ranking of different foods and is useful in estimating how much sugar will the body have to deal with. There are a lot of junk articles online about GI, it is always a good idea to go to the research programs rather than use popular media sources for information. For example, the University of Sydney’s website on GI is a good source of information on GI.
Glycemic Load is another number that factors in the recommended serving size. It is calculated by multiplying the GI with the recommended serving size. So it gives a much more realistic representation of how much increase in blood sugar one can expect after eating a certain food item. A high GI food item eaten in a small quantity would not increase the blood sugar level too much, whereas, a medium GI food eaten in large quantities during a meal would dump a whole lot more sugar than one would like.
Now one thing that neither of these two numbers capture is how soon the carbohydrates from the food reach the blood and increase blood sugar levels.
If one plots the blood sugar levels measured in an individual after eating a meal, it will increase up to a certain level and then begin to drop. GI is the area under the curve. Anyone who has studied college math (and remembers it!) will immediately recognize that the area can be the same for two curves with very different rate of rise, or even different peak values. When we are trying to identify how our body is stressed during digestion and absorption of nutrients, the rate of change in blood sugar levels is a critical parameter.
And surprisingly, there is a simple number one can use to get a measure of this – the carbohydrates to fibre ratio. For convenience, lets call it the ‘C/F’ of a food. Digestive juices need to soften and move through the ingested fibre before they can get to the sugars. So a high fibre food item would have a slower release of sugars compared to the same item with low fibre content. Based on this idea, the Harvard School of Public Health has promoted the 10:1 thumb rule to assess if a food item is whole grain or not.
So lets see the comparative nutritional table for millets and do the math to calculate the C/F for each of the food items. And the resulting table is …
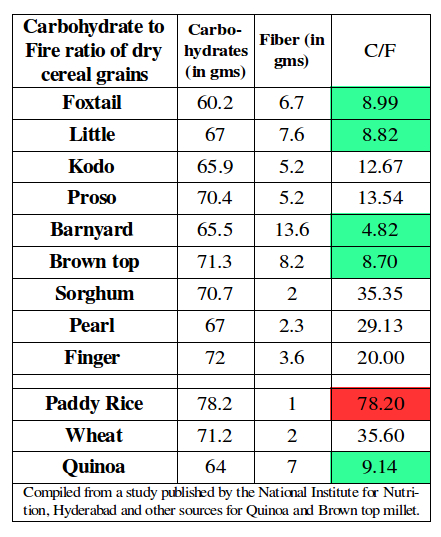
There are two main advantages of using C/F rather than GI when assessing how good a particular food item is.
- It can be identified with just a simple division operation that a consumer can do looking at the nutritional label and does not need lab testing and trials.
- It is a better reflection of how it affects a person concerned about diabetes and controlling blood sugar levels.
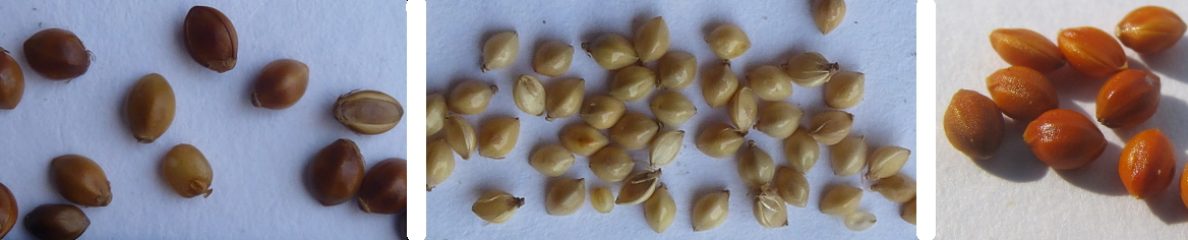
The primary nutrition we derive from our cereals is the energy from its carbohydrate content. But this needs to be moderated to decrease its rate of release into the blood stream. And this is achieved by having a good fibre content. The secondary nutritional components we derive are the minerals and essential fatty acids. Note that within a grain, carbohydrates are found in the endosperm, the inner (typically white) portion of the grain that forms a majority of its volume and mass. Fibre is mostly found in the bran, a thin protective layer around the grain also rich in minerals, essential fatty acids.
So looking at it beyond the labels and nutritional analysis, it is a fairly simple thing to remember when shopping for something to eat:
Has bran? Good
No bran? Naaa!
I do advocate for people to move to whole grains, not just in millets, but also with paddy rice and wheat. And at the same time I recognize that as with everything else in life, one has to compromise when negotiating what food to eat. So if eating polished/semi polished millets will get your family to accept it. Do make the shift. Gradually shift towards products that still have the bran layer.


So in the table on comparative nutritional profile of grains, the carbs mentioned are total carbs, and not net carbs?
LikeLike
Good question. Very likely it is the total carbs, i.e. the fiber measure would already have been removed. Though I should note that the source did not identify this explicitly, so I do not know for sure whether it has been reduced or not.
Re: net carbs – it is a much harder question to answer as that depends on the nature of the fibre. And this varies significantly from grain to grain and from what I recall, the original source did not have much information on the methodology followed… need to go look at that source sometime. So as far as I can tell from what I recall from a not so good memory, if they are presenting it as net carbs, I would not wager any bets on the accuracy of that data point.
LikeLike
Nice site… Lots of info… It’d be good to create a FB page for this blog, so that people like me could follow your thoughts… Somehow, RSS feeds never really seems to work out for me!
LikeLike
Thank you ! This blog is linked to my personal facebook profile.
I agree on the RSS thing, I have a few marked too. But rarely open those. Push notifications have spoiled us to the point where the quiet & non disruptive RSS seems, well quiet. 🙂
LikeLike
A very well written article Dwiji…Hats Off!
– Arun
LikeLike
thank you Arun ! 🙂
LikeLike
Would be interesting to find out what the C/F is for unpolished rice, unpolished basmathi rice, par-boiled red and white rice. Any data on this?
Also noticed that the C/F of Jowar is very close to that of wheat. And pearl and finger millet though better, are no way close to the minor millets. Any idea if the data is based on flours or grits or semolina?
LikeLike
> Would be interesting to find out what the C/F is for unpolished rice, unpolished basmathi rice, par-boiled red and white rice. Any data on this?
Yes, you are right. It would be different for different varieties. It would also be different for different processing methods – hand vs. machine processed, shear milled vs. impact milled, raw vs. par boiled, etc.
Data for some of the more famous varieties are out there, but I haven’t compiled it. And I know our friends at Sahaja Samrudha have the nutritional profile of some of the native varieties of paddy as well. Would be great if someone could compile it.
> Also noticed that the C/F of Jowar is very close to that of wheat. And pearl and finger millet though better, are no way close to the minor millets.
Good observation. Finger, Pearl and Sorghum are naked grains and their morphology is distinct from that of the minor millets. So the difference along those lines is not surprising, though I do not have an explanation for why that is so.
> Any idea if the data is based on flours or grits or semolina?
As far as I can find out from the published data, these were whole grains while the reference ones, paddy rice and wheat were those that were commonly available in the market. But no, I do not know for sure.
I would like to resist the temptation to start looking for more indicies and numbers to map our food. I am trying to identify ways to help us relate to our food in more fathomable, touch and feel ways – for ex. the test to see if a millet rice one is purchasing still has some of its bran layer (https://dwiddly.wordpress.com/millets-in-the-market/)
LikeLiked by 1 person
-the test to see if a millet rice one is purchasing still has some of its bran layer
All the millet I buy today is pre-packaged – cant, touch and feel anything. Anything to look for from the see-through plastic packaging?
LikeLike
You can buy the smallest pack, cook it, test for bran. If you are not satisfied with the amount of bran on it, or something else disappoints you, switch to a different brand/shop. Even if the millet is polished, it will not harm you, its just that it will not benefit you as much. And the money you spent for that pack is likely to go to some small social enterprise or farmers group some place … and a struggling retail store.
Life goes on, there’ll be opportunities to make corrections. 🙂
LikeLike